PN.26.026. Data. Studio project, 2026.
The Paradox in the Admissions Office
A scrolled data story using the real 1973 Berkeley admissions figures, where every part of the picture leans one way and the whole leans the other.
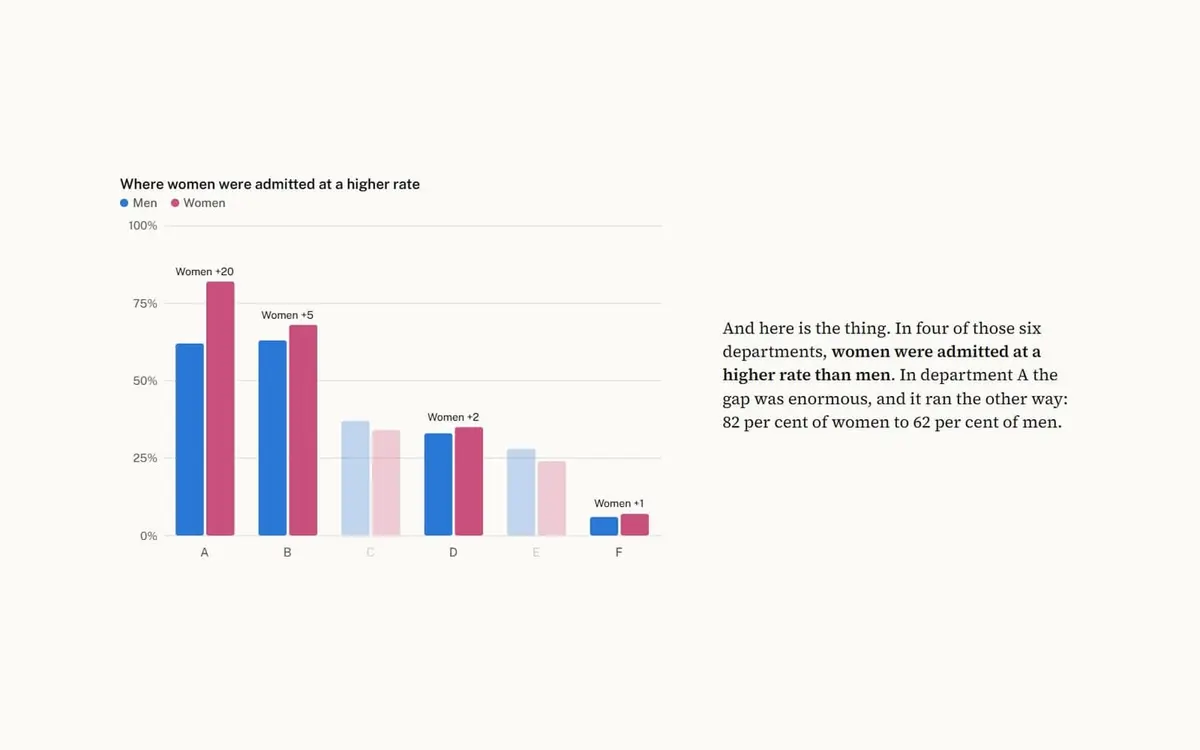
The brief
Tell an analytical story with real, verified data.
The idea
One chart cannot explain Simpson's paradox, but seven consecutive ones can. The same bars rebuild themselves as you read, until the headline that looked like discrimination turns out to be about which door people knocked on.
Decisions
- Real published data, cited, in a full table at the foot of the page.
- The figure stays still while the text moves, so the eye tracks changes in one place.
- Blue and magenta come from the validated palette, and each bar also has labels.
- It ends on the honest limit: the data cannot say why the choices differed.
How it came together
- Used the six-department table from Bickel, Hammel and O'Connell, Science, 1975.
- Wrote the argument as seven steps, each with one change to the picture.
- Separated overlapping bubbles and widened the chart after review.
How it works
Each scroll step redraws one SVG from the same dataset, triggered by IntersectionObserver.
Want something like this?
Tell us what you are making. A few lines is enough to start.
Hanging nearby

 The DescentScroll from the sunlit surface to the floor of the Challenger Deep, eleven kilometres down, with a live depth and pressure gauge.PN.26.027. Interactive article.
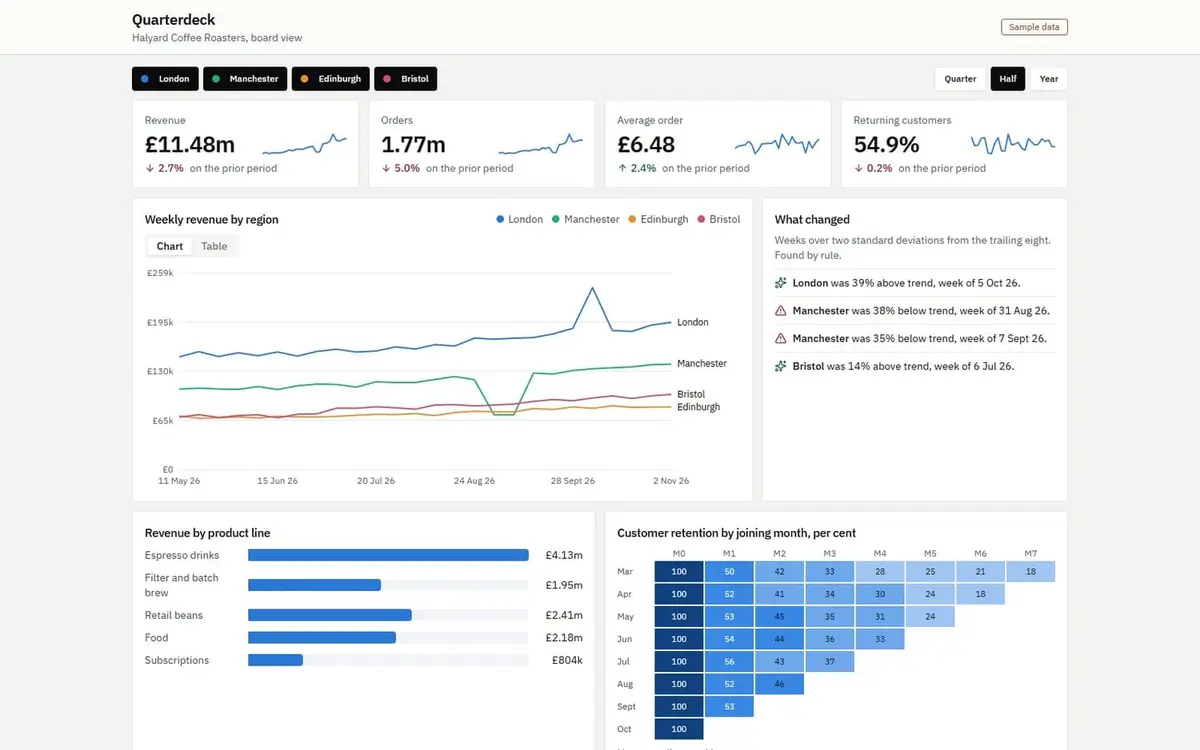
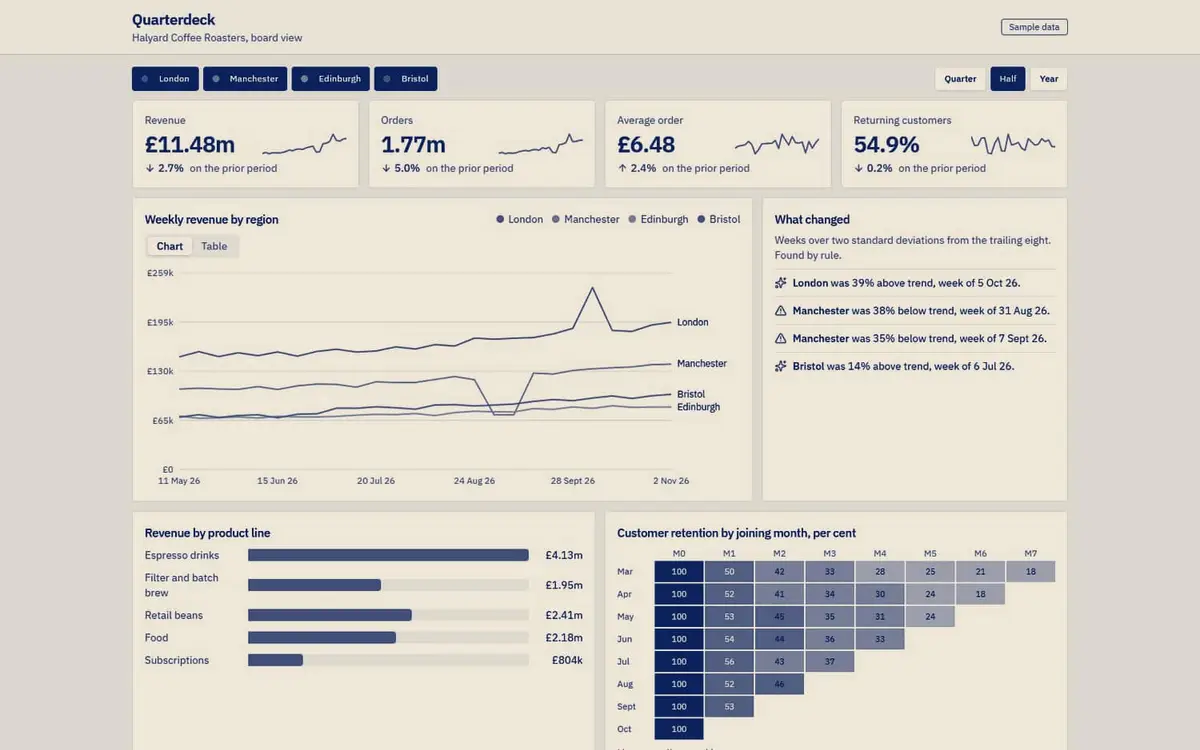 QuarterdeckA board-level dashboard for a coffee roaster, with computed callouts that find what changed, so the numbers explain themselves.PN.26.025. Interactive dashboard.
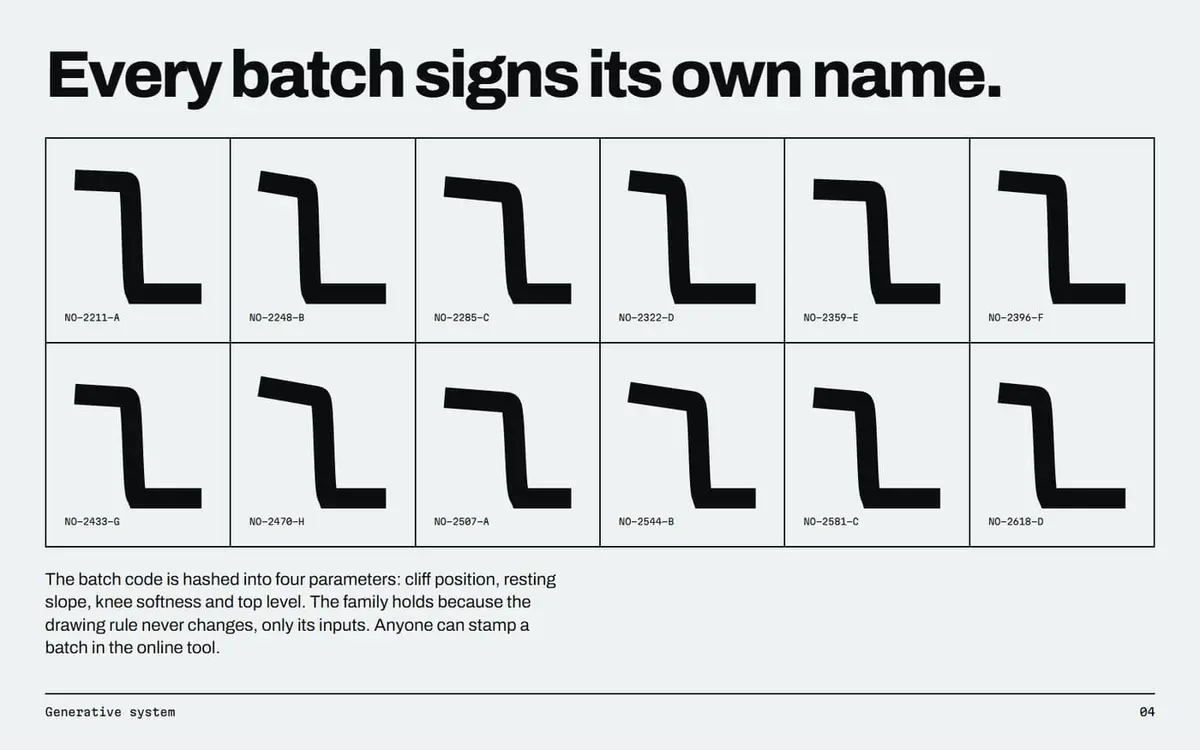
 NullohmAn identity for a superconductor maker, where every cable batch stamps its own logo from its batch code.PN.26.008. Logo files, Brand book PDF.