PN.26.025. Data. Studio project, 2026.
Quarterdeck
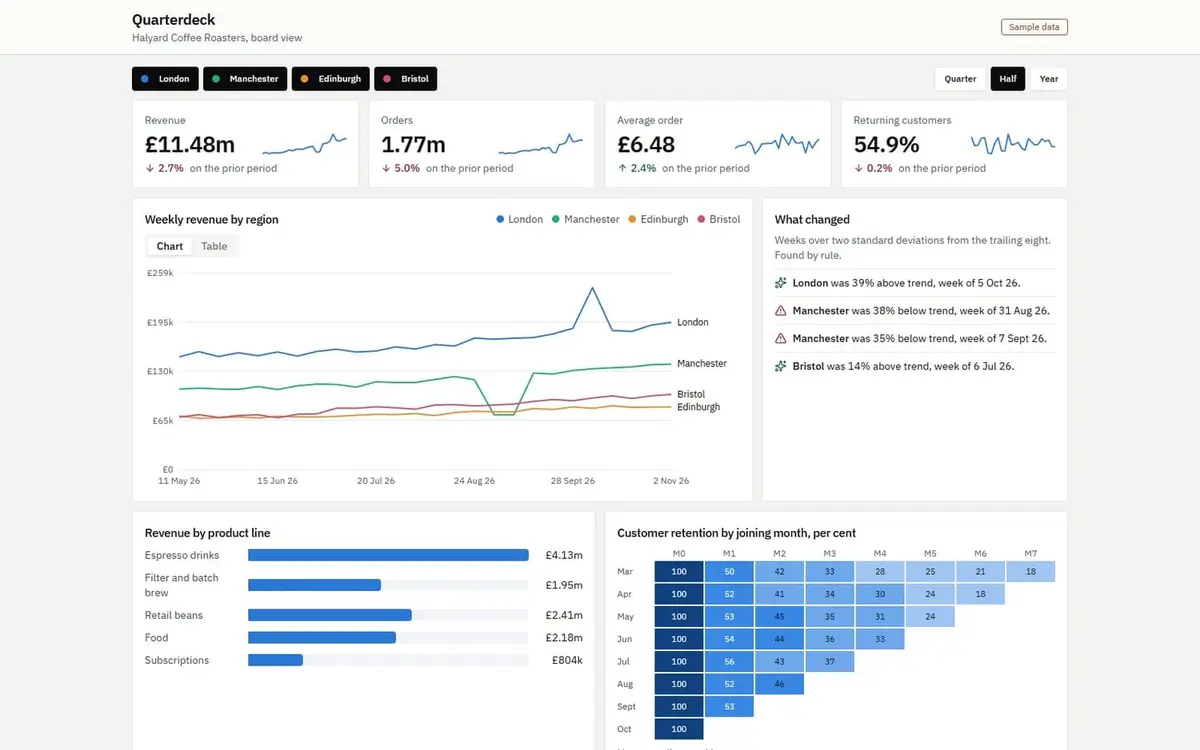
A board-level dashboard for a coffee roaster, with computed callouts that find what changed, so the numbers explain themselves.
The brief
Create a compelling executive analytics experience using clearly identified sample data.
The idea
A board does not need more charts. It needs to know what changed. So Quarterdeck pairs a few honest charts with a panel that finds unusual weeks by a fixed statistical rule. The model underneath has real events planted in it, and the rule finds them.
Decisions
- One axis everywhere, and two measures never share a chart.
- The colour palette was validated for colour-blind separation by script, not by eye.
- Regions keep their colour when others are filtered out.
- Every chart has a table view, and the sample data label is on the page at all times.
How it came together
- Built a seeded weekly model with growth, seasonality and planted events.
- Picked each chart form from the job of the data, then validated the palette.
- Added filters, tooltips, sort and a table view, then fixed a mobile overflow found by test.
How it works
React and shadcn/ui, bundled by Vite. Charts are hand-built SVG with crosshair and tooltip layers. A week is flagged when it sits over two standard deviations from its trailing eight.
Want something like this?
Tell us what you are making. A few lines is enough to start.
Hanging nearby
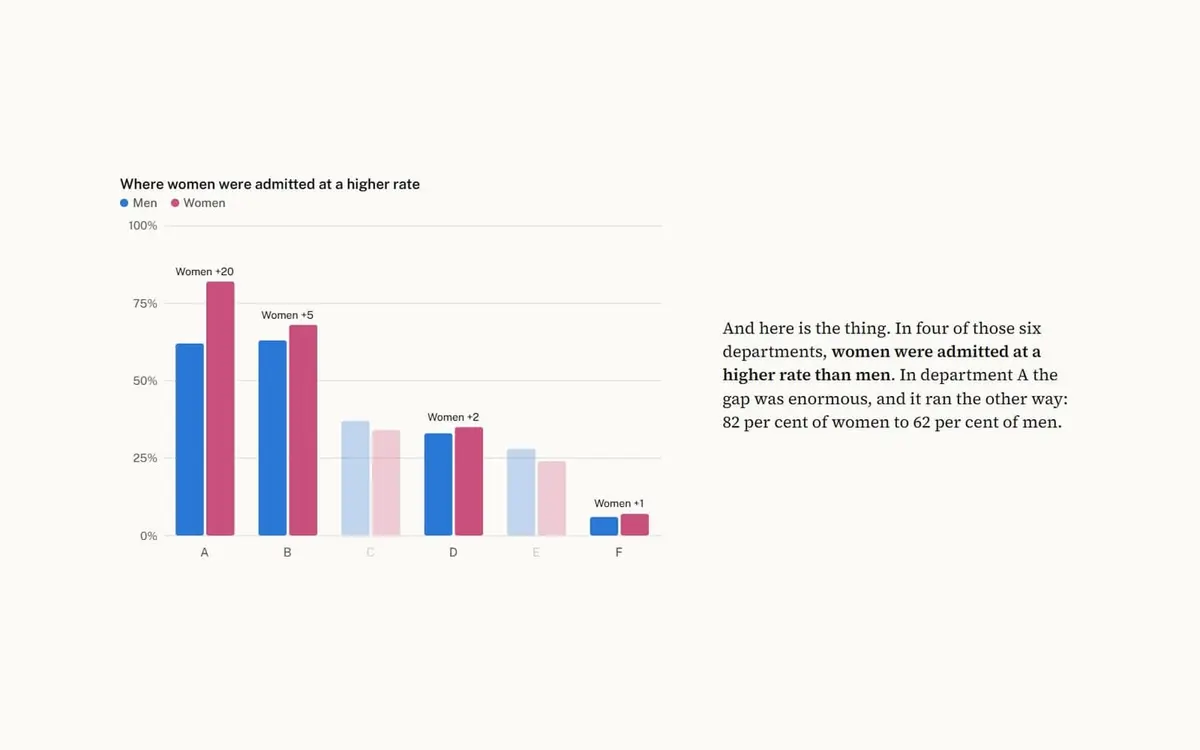
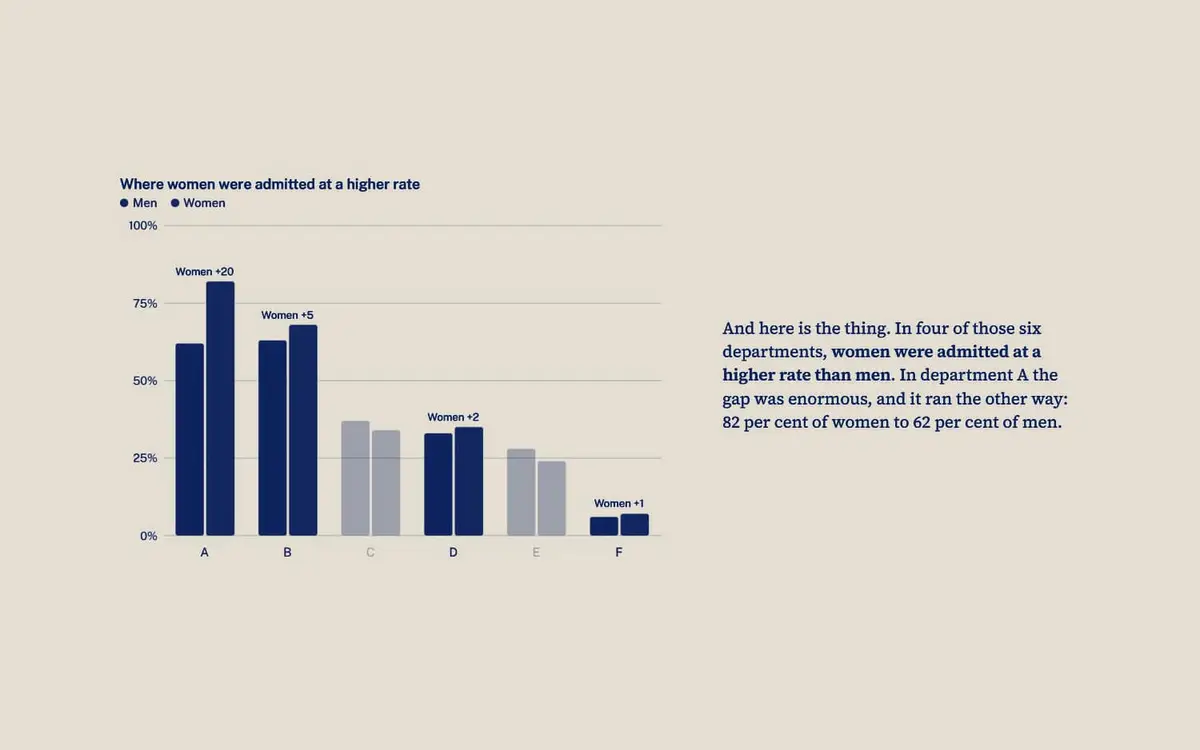 The Paradox in the Admissions OfficeA scrolled data story using the real 1973 Berkeley admissions figures, where every part of the picture leans one way and the whole leans the other.PN.26.026. Interactive article.
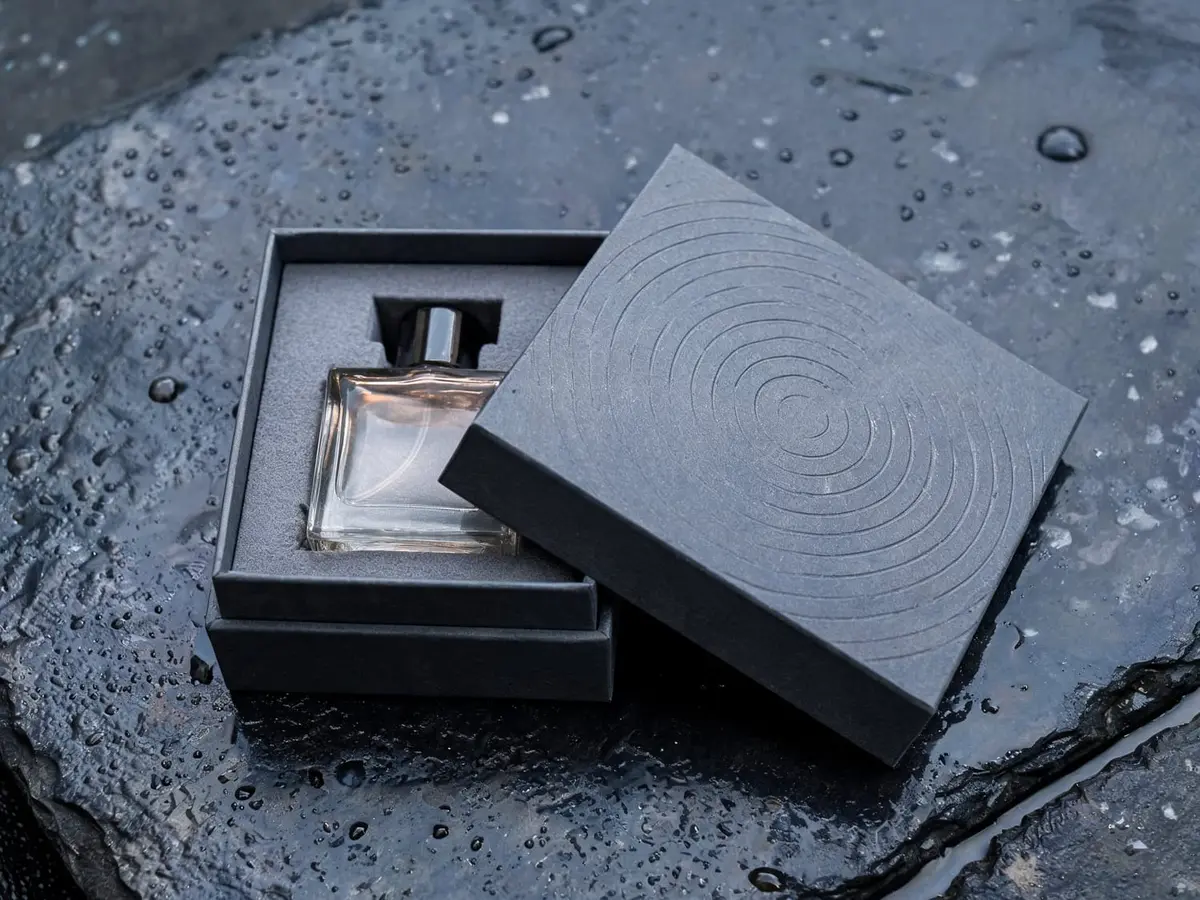
 Maison OndéeAn identity for a Paris perfumer that bottles one thing: rain, at five different weights.PN.26.002. Logo files, Brand book PDF.
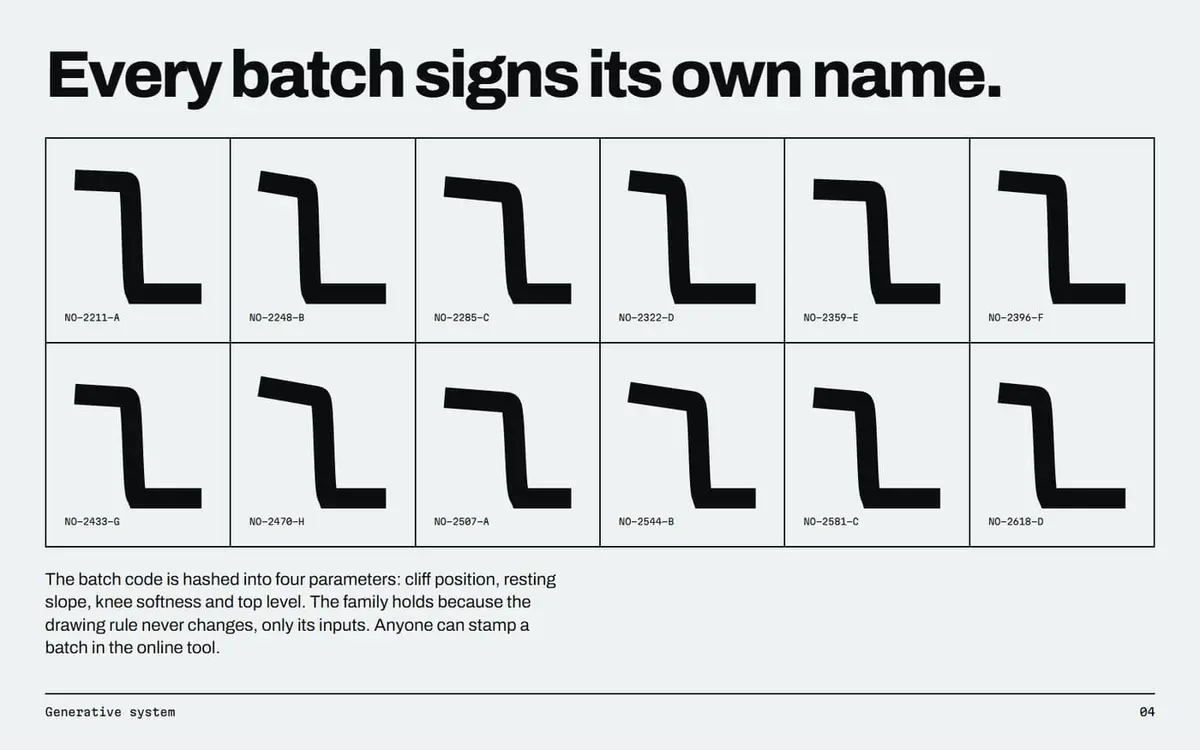
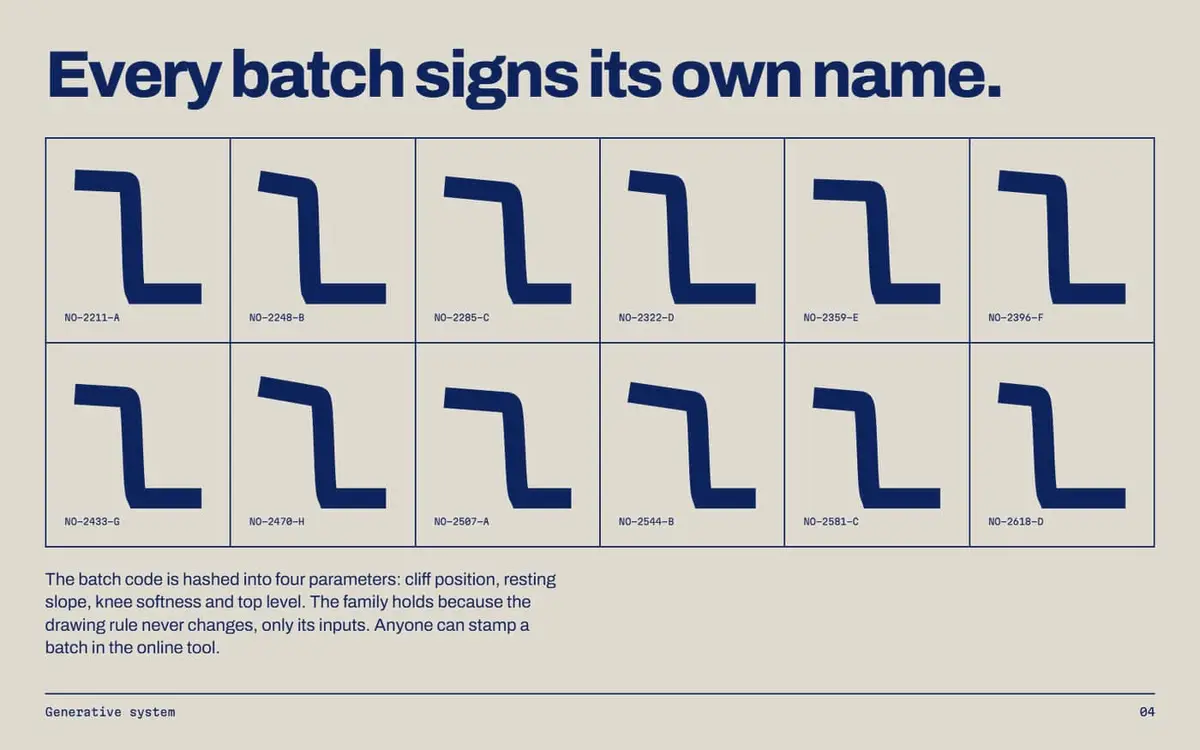 NullohmAn identity for a superconductor maker, where every cable batch stamps its own logo from its batch code.PN.26.008. Logo files, Brand book PDF.